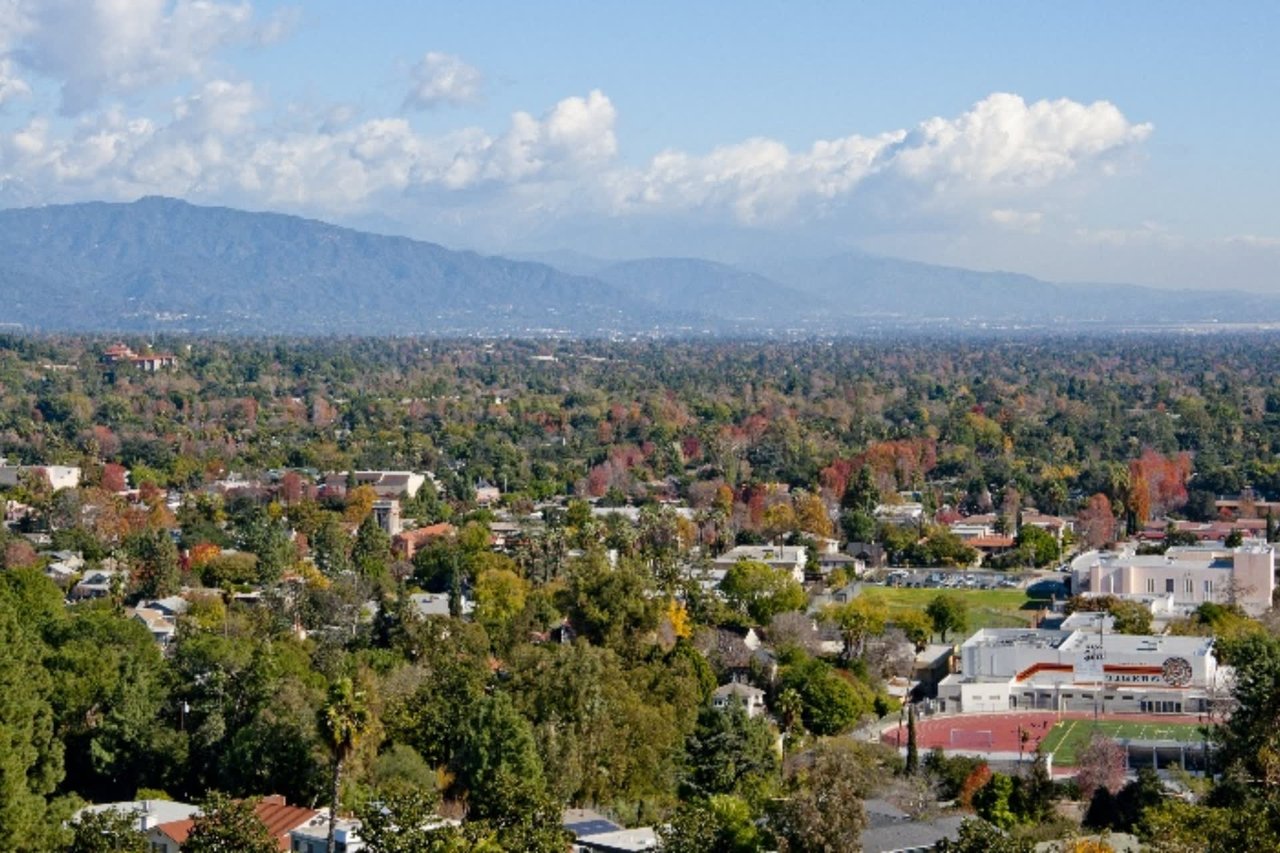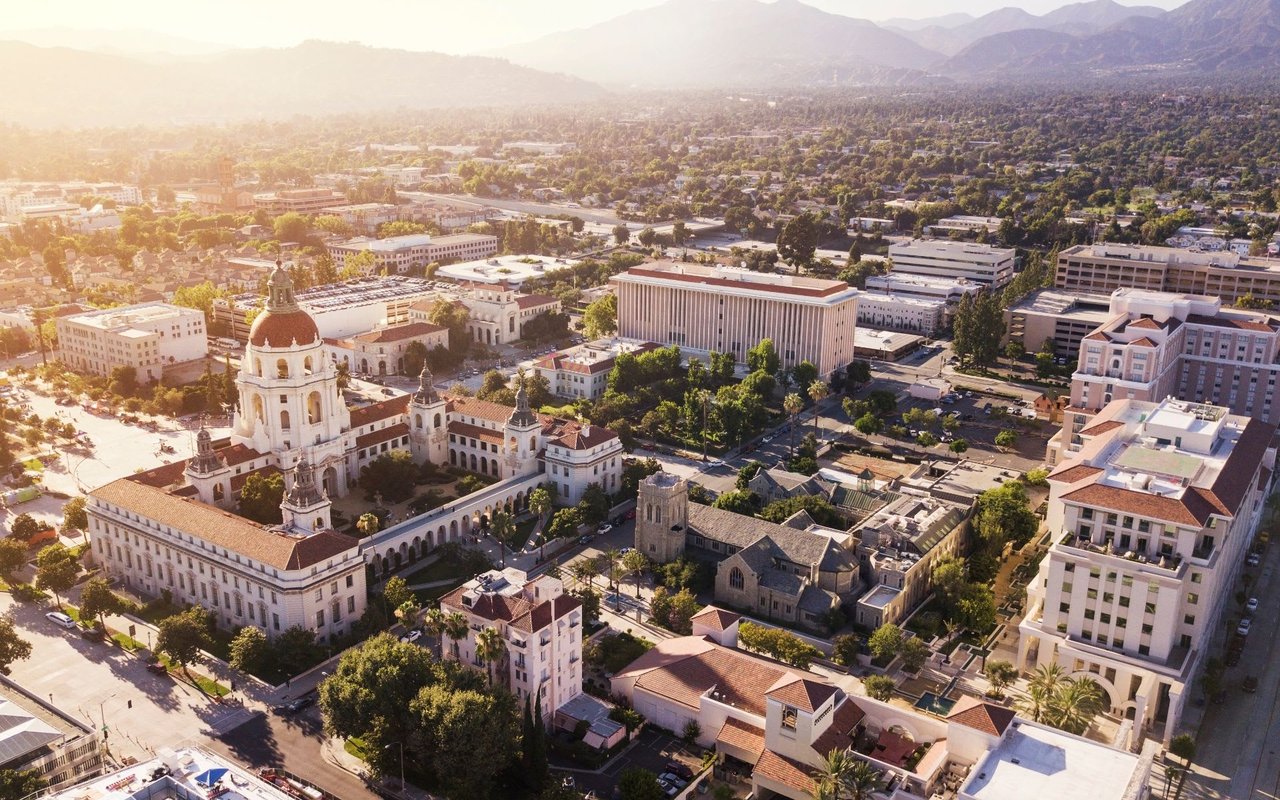
Open Redfin and Pasadena looks like a single market with a single price. Redfin's May 2026 read shows a citywide median of $1.2M, down 1.7% year over year, with homes selling in about 32 days on four offers on average. Zillow's Home Value Index for the same month puts the average closer to $1.08M. Both numbers are accurate. Both are also nearly useless for deciding what to offer on a specific house, because Pasadena is not one market. It is at least two, stacked on top of each other, and the citywide median is the shadow they cast together.
That is the thesis of this piece. If you are comparing Pasadena to San Marino, Arcadia, or South Pasadena using portal medians, you are comparing an apple to a fruit basket.
The number blends two very different transactions
The clearest way to see the problem is to split the citywide figure into the two products it contains. PropertyShark's Q1 2026 breakdown puts the Pasadena house median at roughly $1.4M and the condo median at $810K. A local Q1 2026 MLS pull by Realtor Wesley Kang lands the single-family-home median at $1,550,000 on 129 sales, alongside 78 condo and townhome sales at a much lower price band, for a citywide quarterly transaction count of 207.
Stack 129 house sales at $1.55M against 78 condo sales at roughly $810K, and the blended median naturally lands where the portals show it: somewhere in the low $1.2Ms. That number describes no house you can actually buy. It is the arithmetic ghost of two markets that rarely compete for the same buyer.
For a buyer weighing a South Pasadena bungalow against a Pasadena listing, this matters immediately. South Pasadena's inventory skews heavily to single-family homes on smaller lots. Comparing its median to Pasadena's blended median understates the Pasadena house market by roughly $300K to $350K.
The sub-market table portal shoppers never see
Pasadena's ten or so recognized districts each carry their own product mix and their own price behavior. Here is what the current data shows across four of the most-asked-about pockets, drawn from public MLS pulls and portal data reported between March and June 2026.
| District | Recent median | $/sqft | Typical DOM | Notes on the sample |
|---|---|---|---|---|
| Citywide (all types) | $1.2M | $791 | 32 | May 2026, 248 sales |
| Citywide (SFR only, Q1) | $1.55M | $874 | 24 in March | 129 sales |
| Bungalow Heaven | ~$1.4M | $857–$878 | 15–17 | Small district, ~4–8 active listings |
| Madison Heights | $815K–$1.9M | varies | 37–40 | Wide spread reflects condo/SFR mix |
| East Pasadena | $2.1M | $930 | 63 | Only 17 sales in May 2026 |
| Linda Vista | $2.9M+ | — | — | Hillside estates, thin volume |
Two entries deserve a closer look, because they show how portal medians misfire in opposite directions.
When a 68% jump is not appreciation
Redfin's May 2026 East Pasadena page shows the median sale price up 68% year over year to $2.1M. Read that number the way it invites you to read it and you conclude that East Pasadena has become one of the fastest-appreciating pockets in Los Angeles County.
Read the footnote and the story collapses. There were 17 sales in May 2026, up from 11 the year before. A shift in the mix of what sold, one or two large trophy houses closing in the same month a few condos did not, moves that median by hundreds of thousands of dollars. The per-square-foot figure, $930 and up 9.7% year over year, is the honest read: East Pasadena is expensive and firming, not levitating.
The reverse trap sits in Madison Heights. Redfin's May 2026 all-home-types median for Madison Heights reads $972,673, down 35.7% year over year. Homes.com's twelve-month median for the same district reads $850,000, down 3%. Flyhomes, filtering to single-family only, shows a median closer to $2.4M on a tiny sample of active listings. All three numbers describe Madison Heights. None of them contradict the others. The neighborhood contains everything from studio condos on California Boulevard to restored Colonial Revivals on wide lots, and whichever slice happens to close in a given month sets the "median."
Days on market is a product signal, not a desirability score
The other portal metric that misleads Pasadena shoppers is days on market. Bungalow Heaven sits at 15 to 17 days. East Pasadena sits at 63. A buyer glancing at those numbers might conclude East Pasadena is a softer market. It is not. It is a thinner one, with a smaller buyer pool for $2M-plus houses and more time required to find the specific buyer who wants the specific house.
Kang's Q1 2026 pull captures the seasonality inside those averages: citywide days-to-sell tightened from 52 in January to 24 in March as spring buyers came off the sidelines, while monthly sales volume climbed from 38 single-family homes to 55.
For a seller, the practical read is that DOM is a function of product depth. A restored Craftsman near McDonald Park in Bungalow Heaven, priced correctly, is competing with two or three other listings for a large pool of character-home buyers, and the transaction clears fast. A hillside estate in Linda Vista may be the only house of its kind on the market that quarter, and clearing it takes a different marketing timeline.
What the money actually buys, district by district
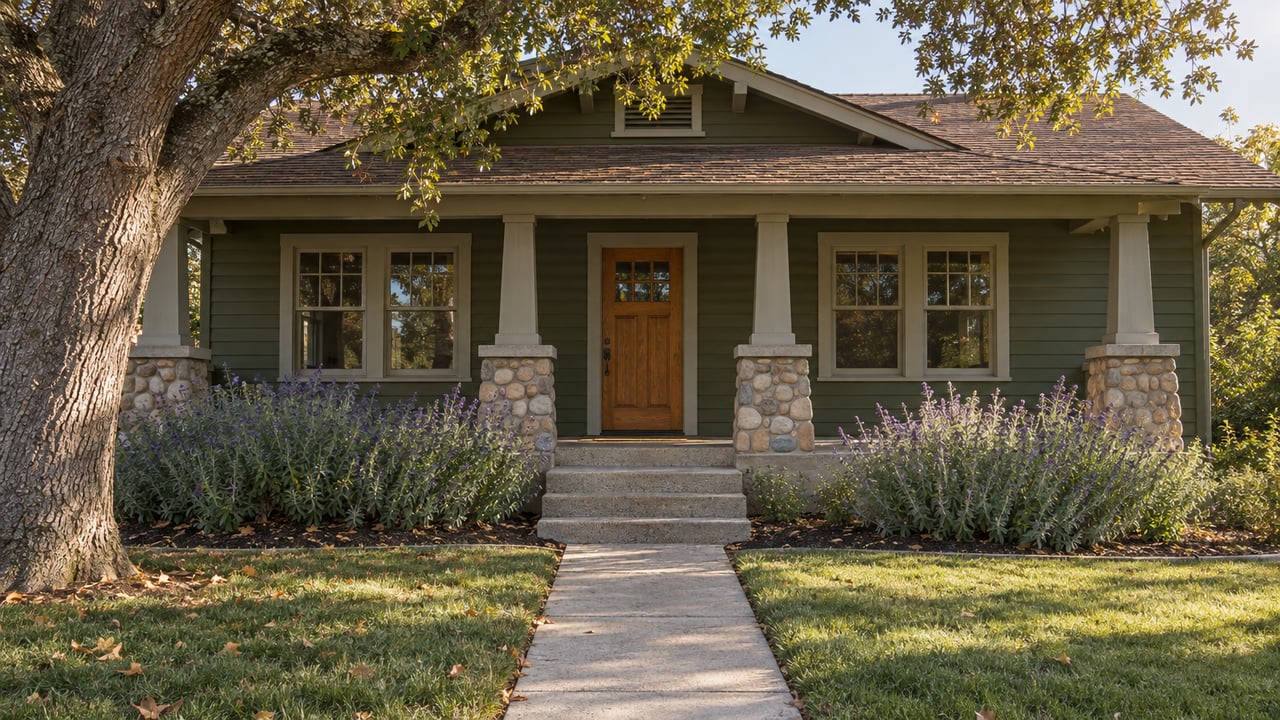
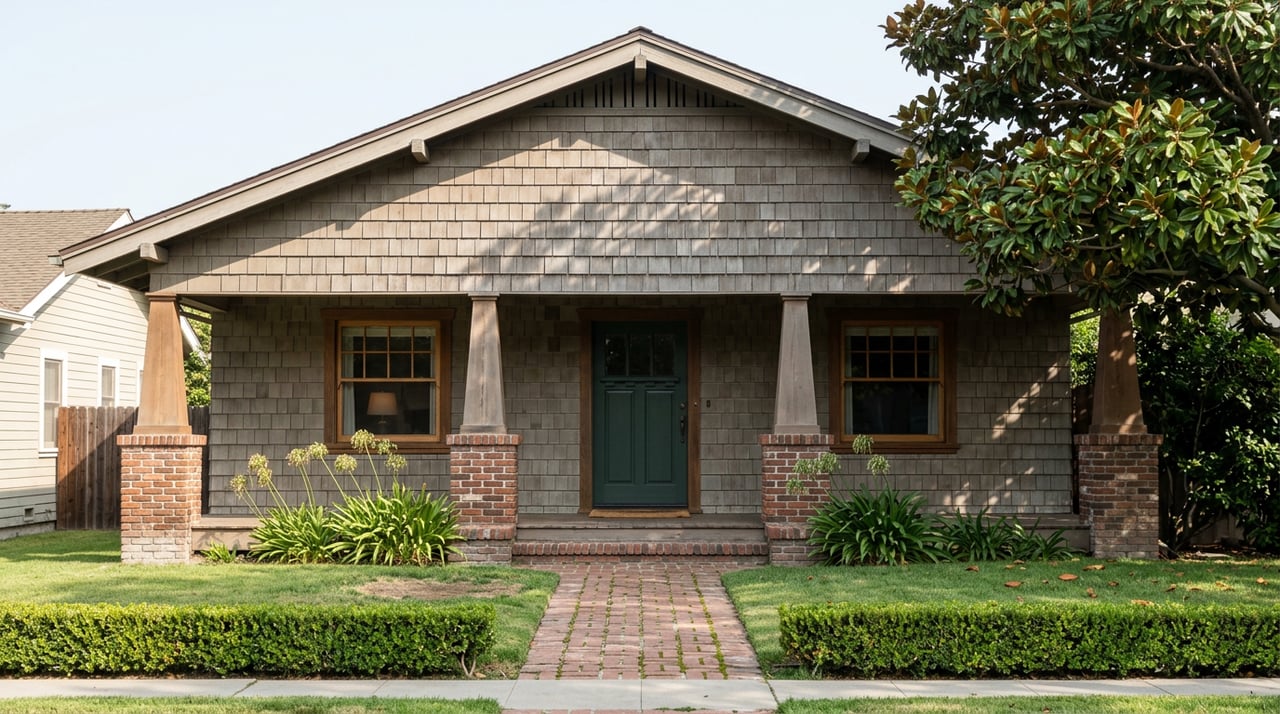
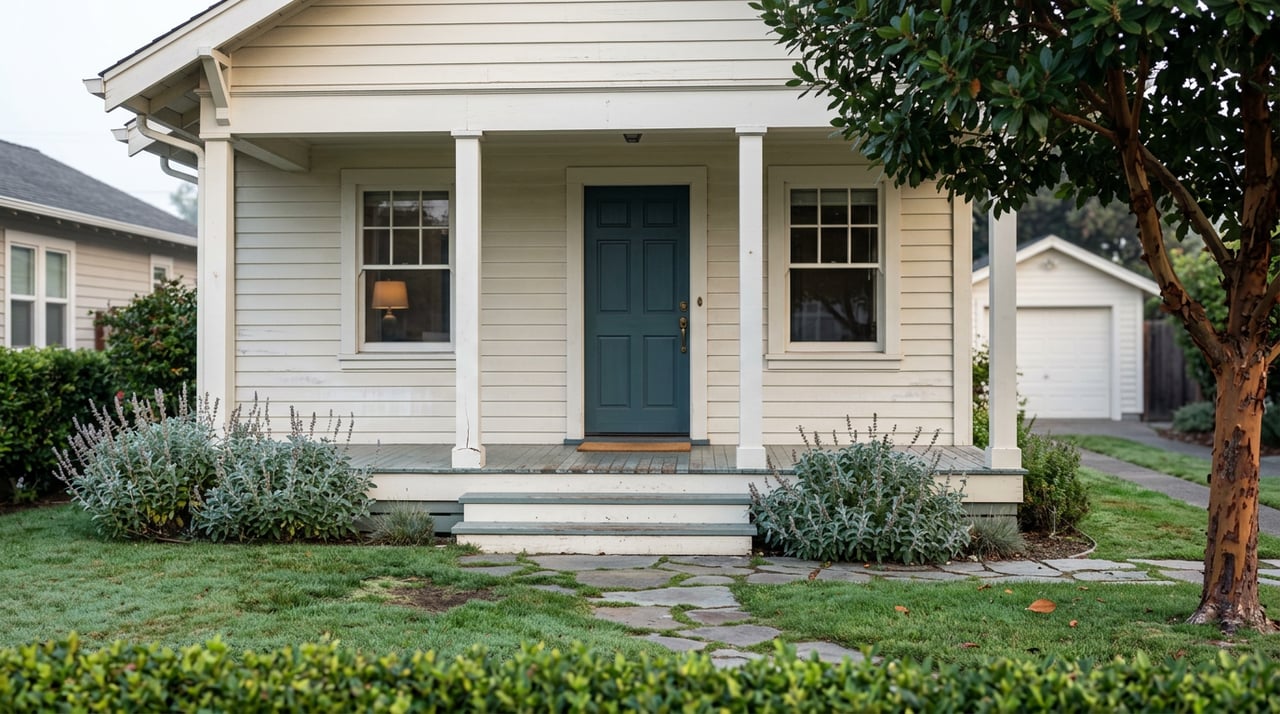
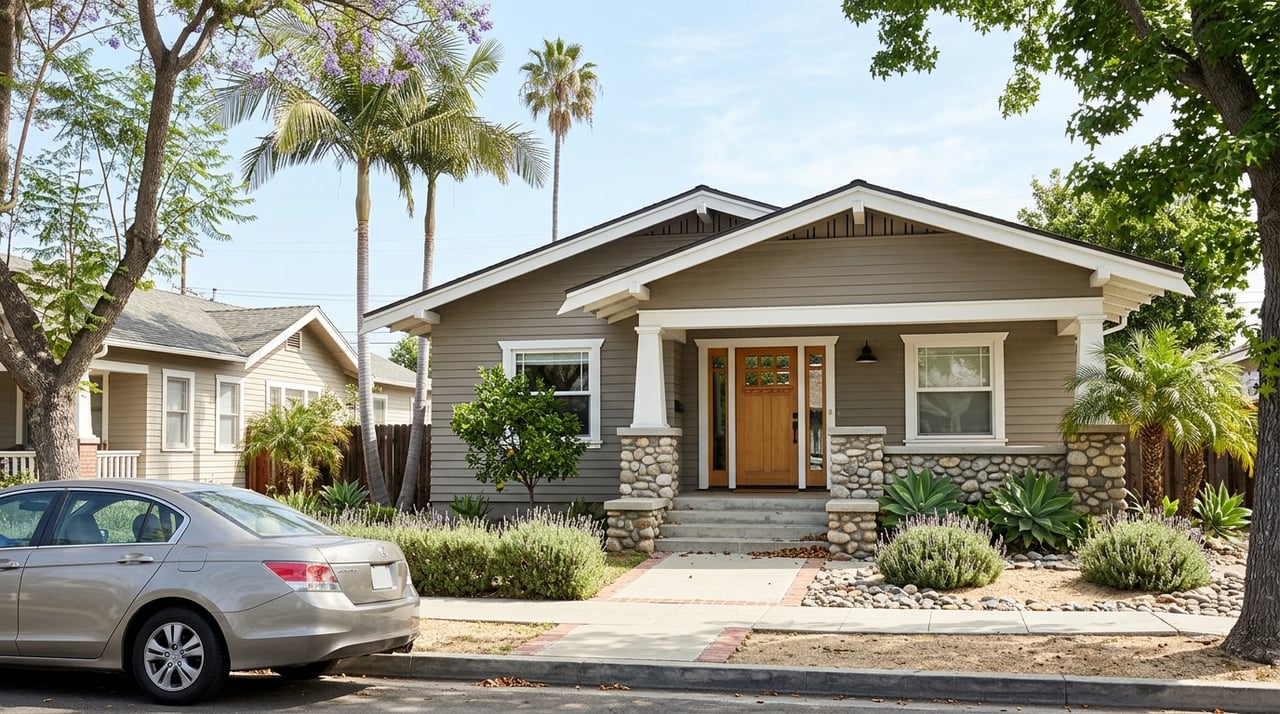
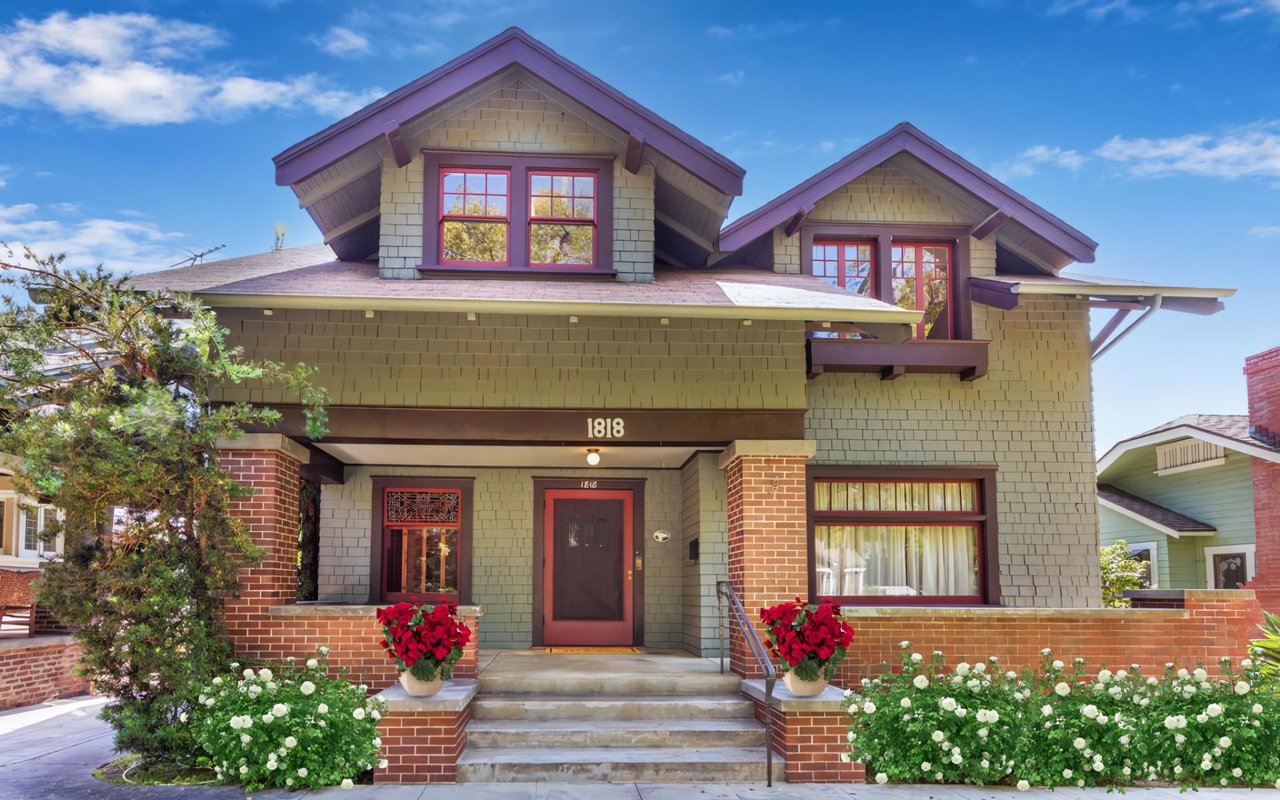
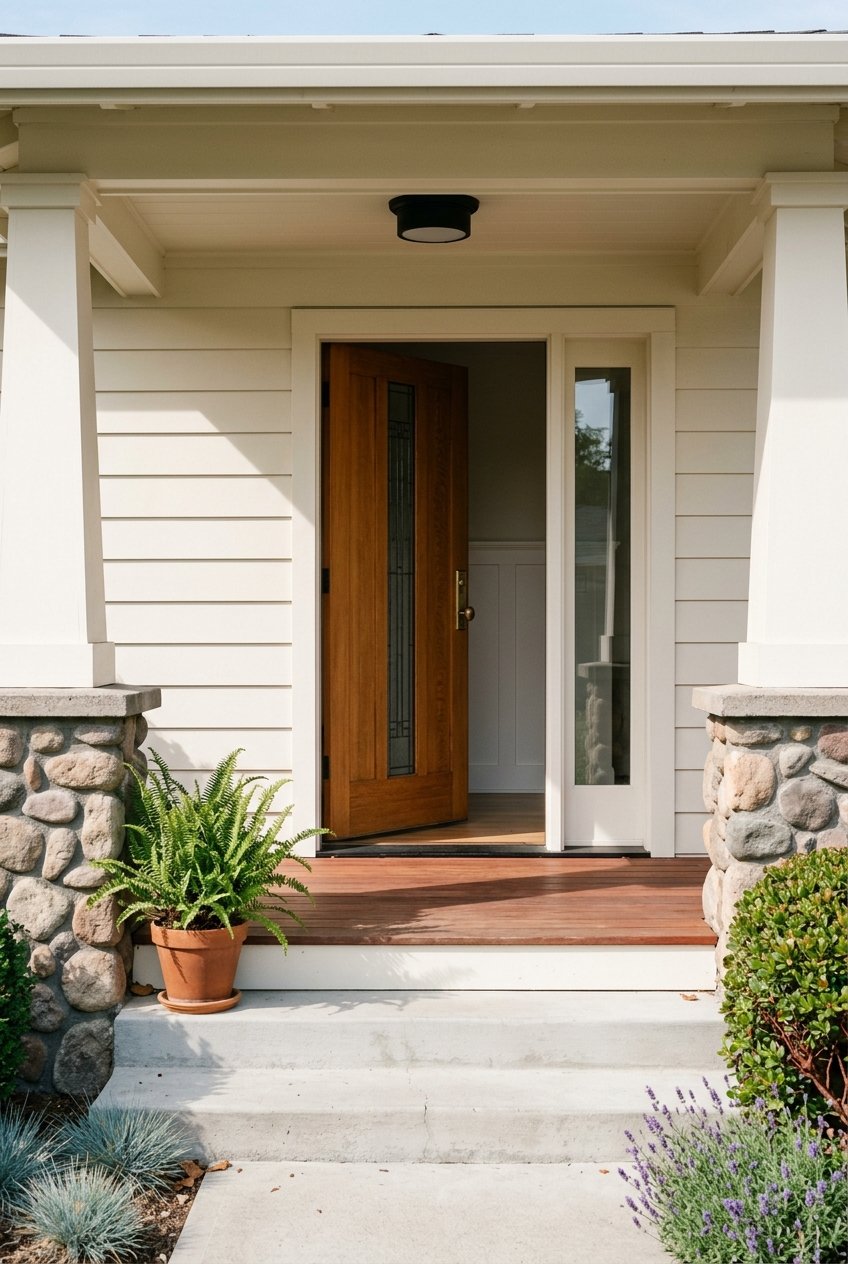
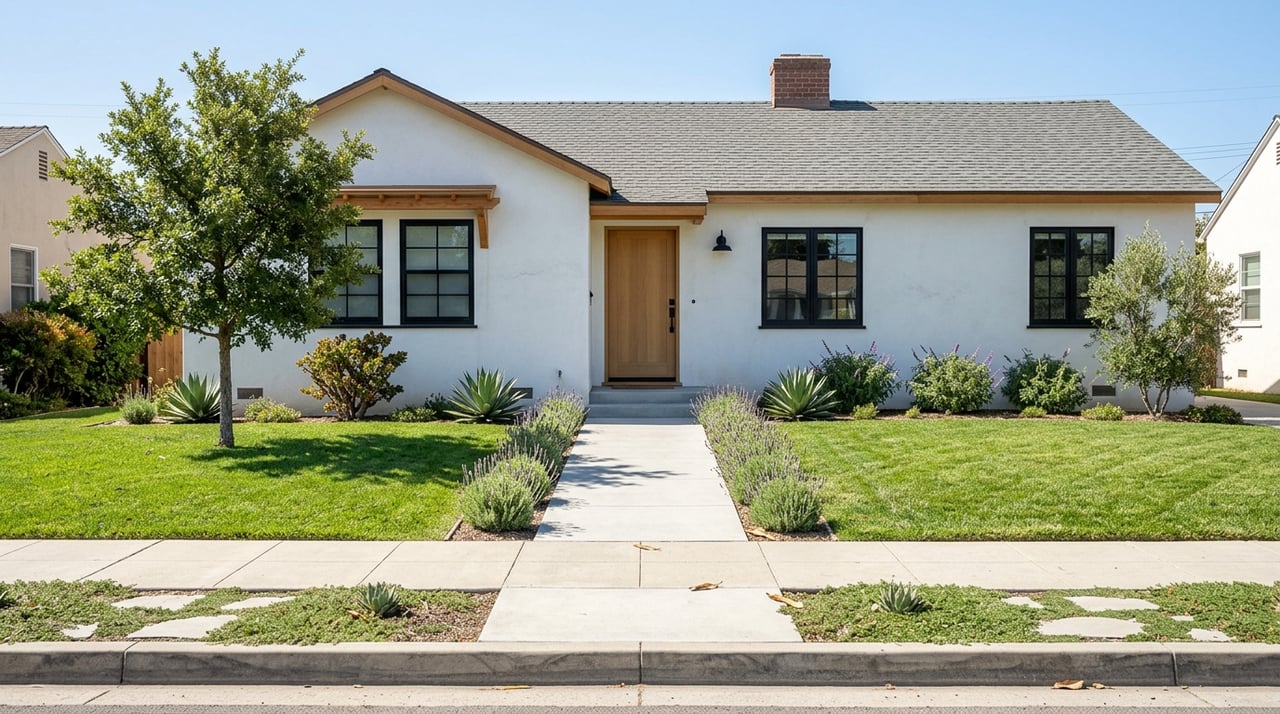
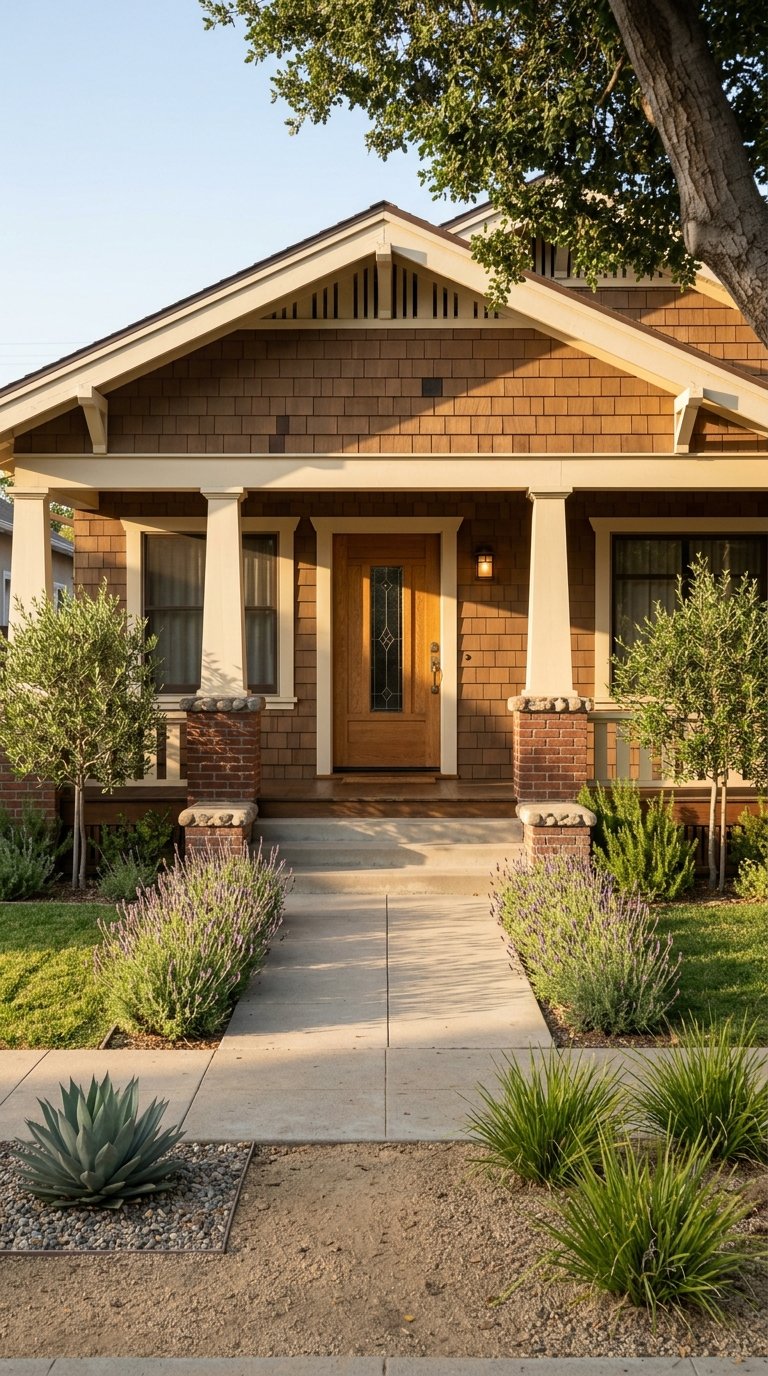
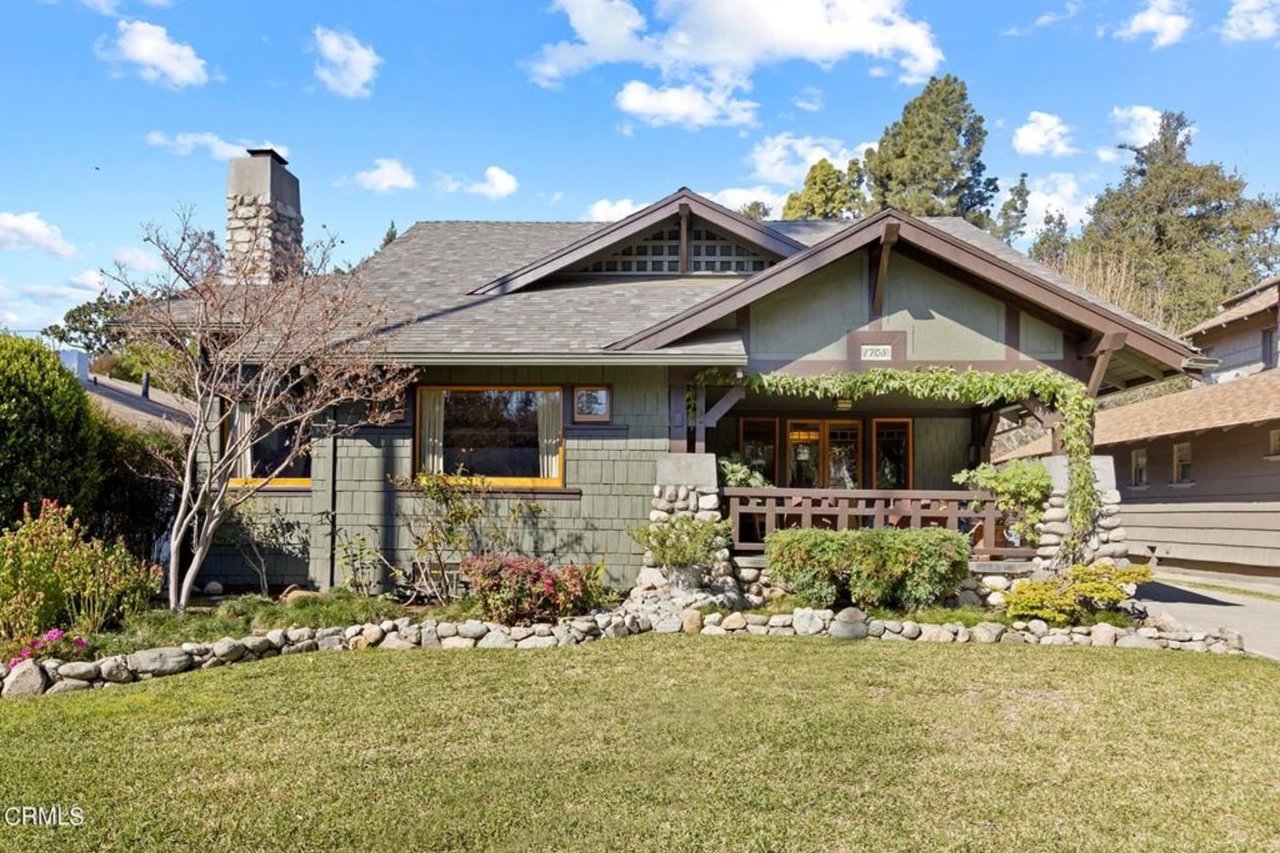
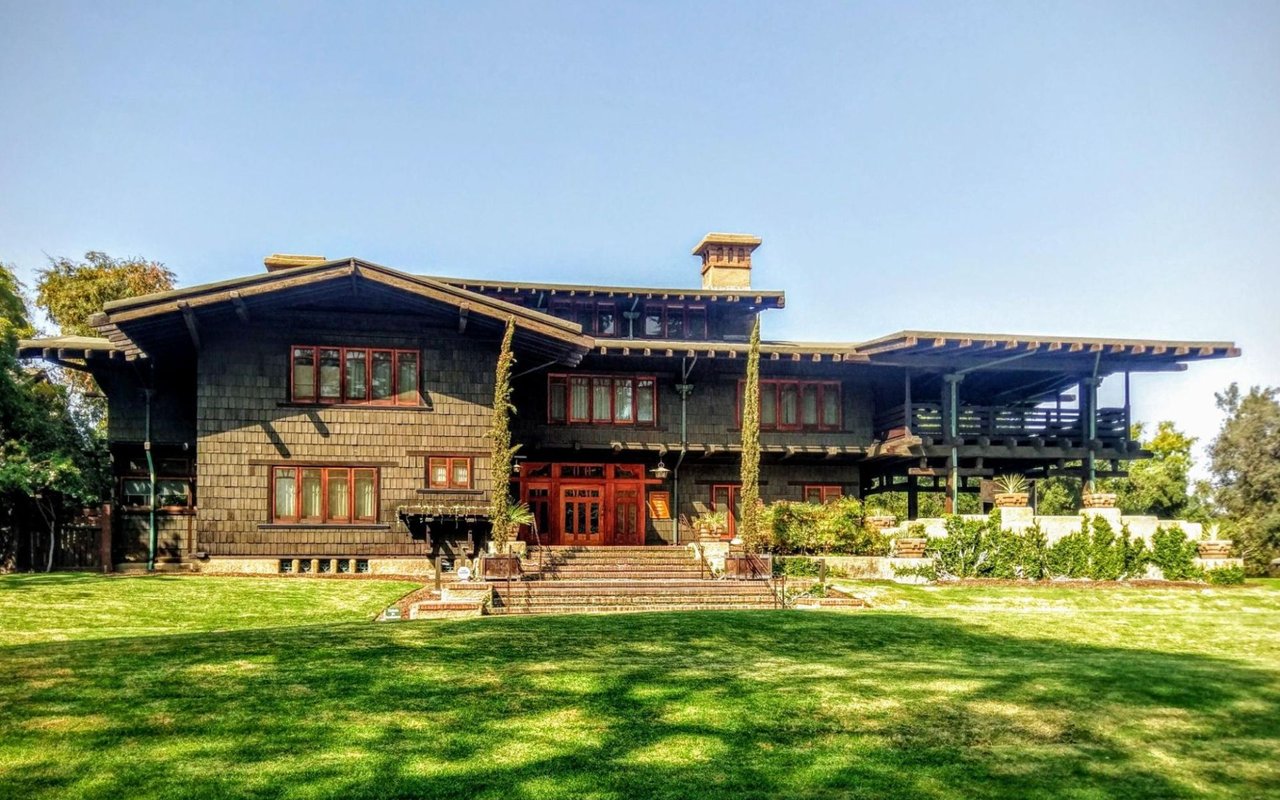
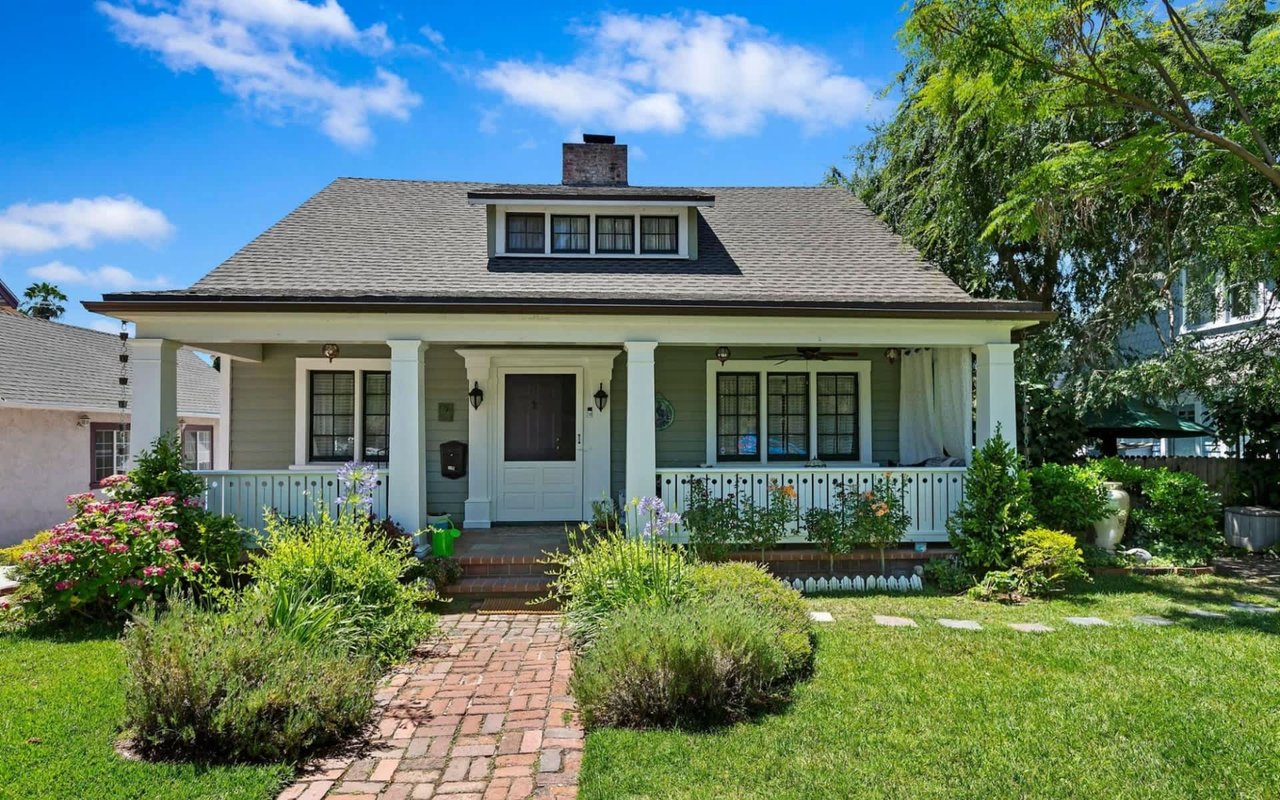
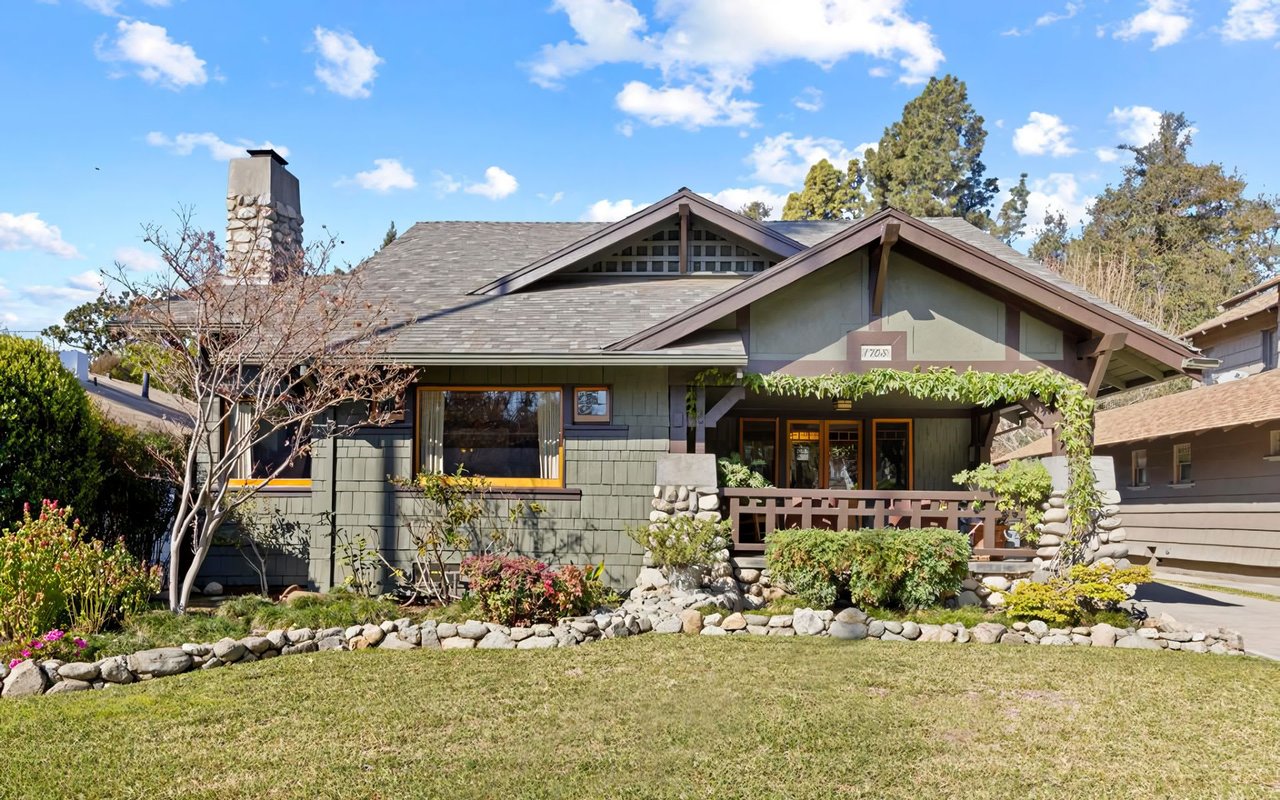
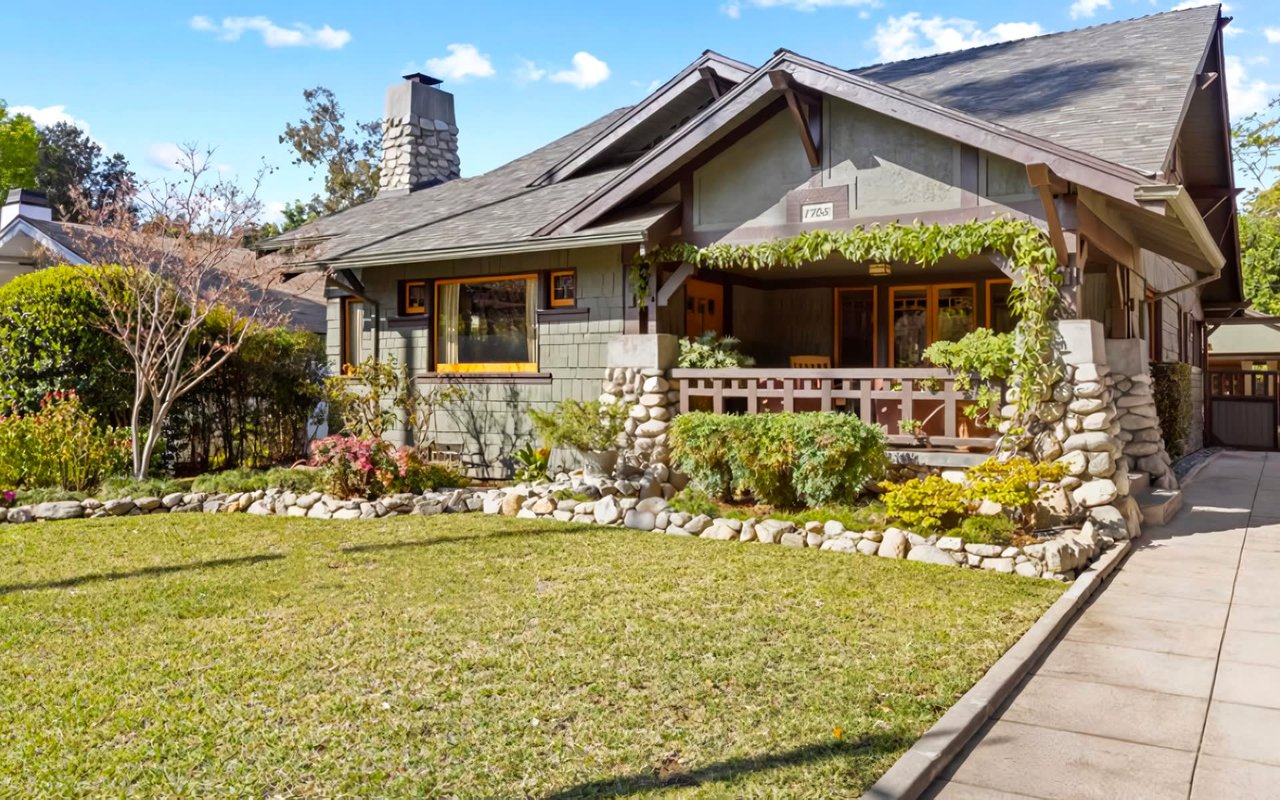
Around $1.4M in Bungalow Heaven. A two- or three-bedroom Craftsman on a 50-foot-wide lot inside Pasadena's first Landmark District, with exterior alterations governed by the district's design review. Walking distance to McDonald Park, the annual April home tour, and the North Lake edge where 1881 and Deluxe 1717 sit. Homes.com pegs the twelve-month median at $1,400,000, up 5%, on 17 days on market. The premium here is for architectural integrity and a tight community, not square footage.
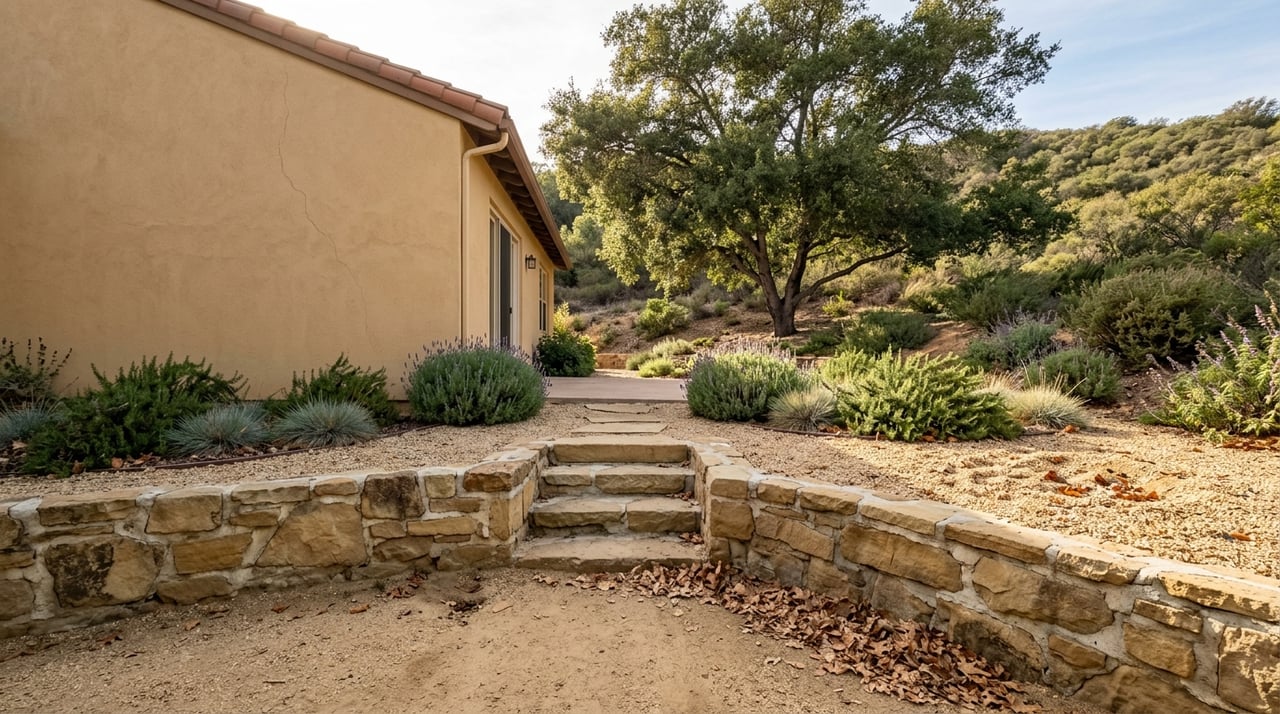
$800K to $1.9M in Madison Heights. The range is the story. At the low end, a condo near California Boulevard within walking distance of Old Pasadena, Caltech, and the South Lake corridor with The Raymond and Lucky Boy. At the high end, a restored single-family home on a larger lot inside the Blair High attendance zone, which runs an IB program. The Metro A Line's Del Mar and Fillmore stations put Union Station about 25 to 30 minutes away by rail.
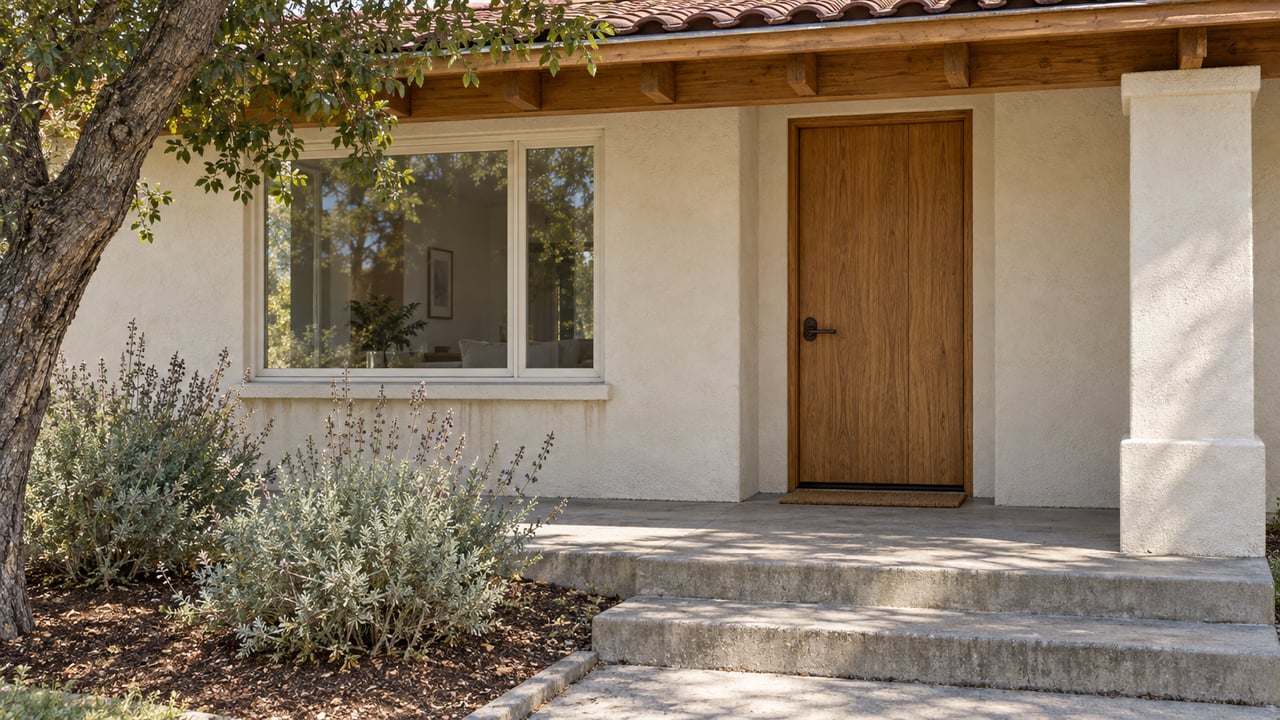
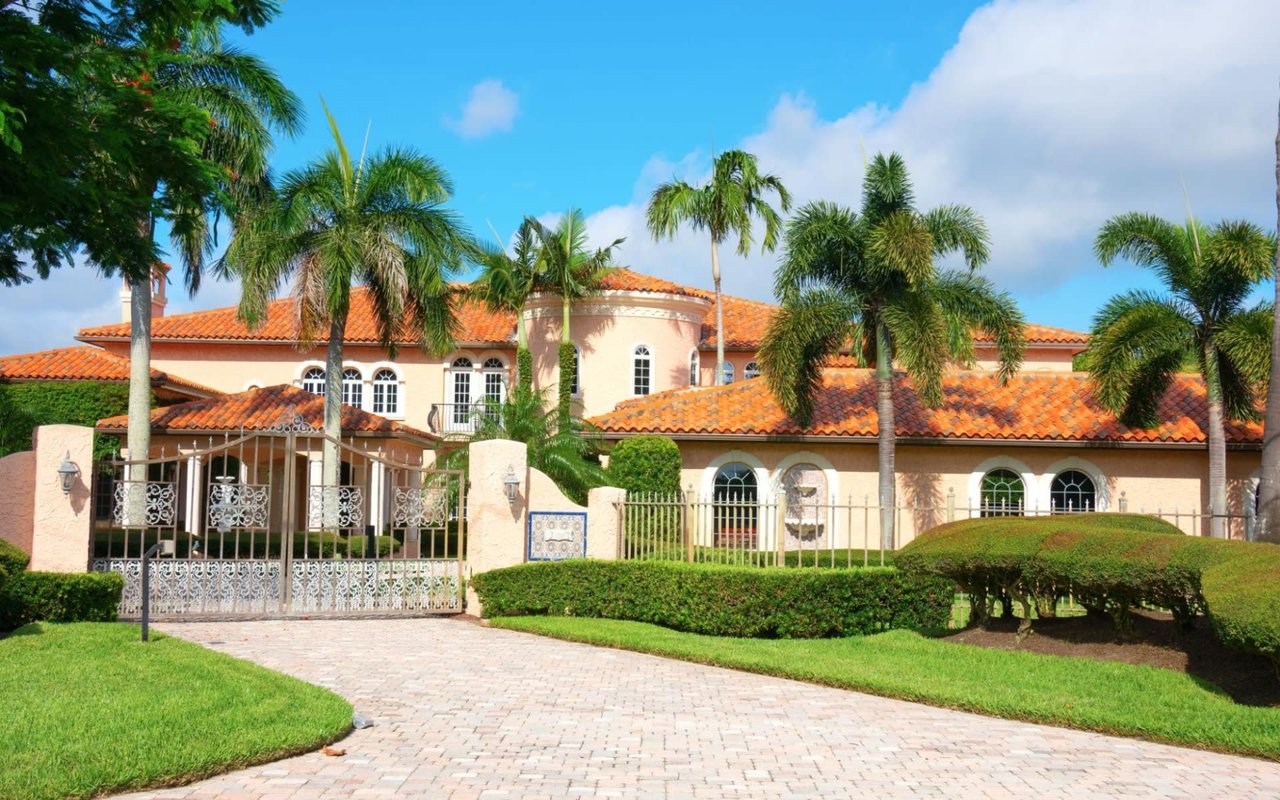
$2M-plus in East Pasadena. More suburban lot sizes, longer marketing timelines, closer to Hastings Ranch shopping and Sierra Madre. A $930 per square foot floor and a 63-day median DOM. Buyers here are usually trading up from within the San Gabriel Valley rather than relocating from out of state.
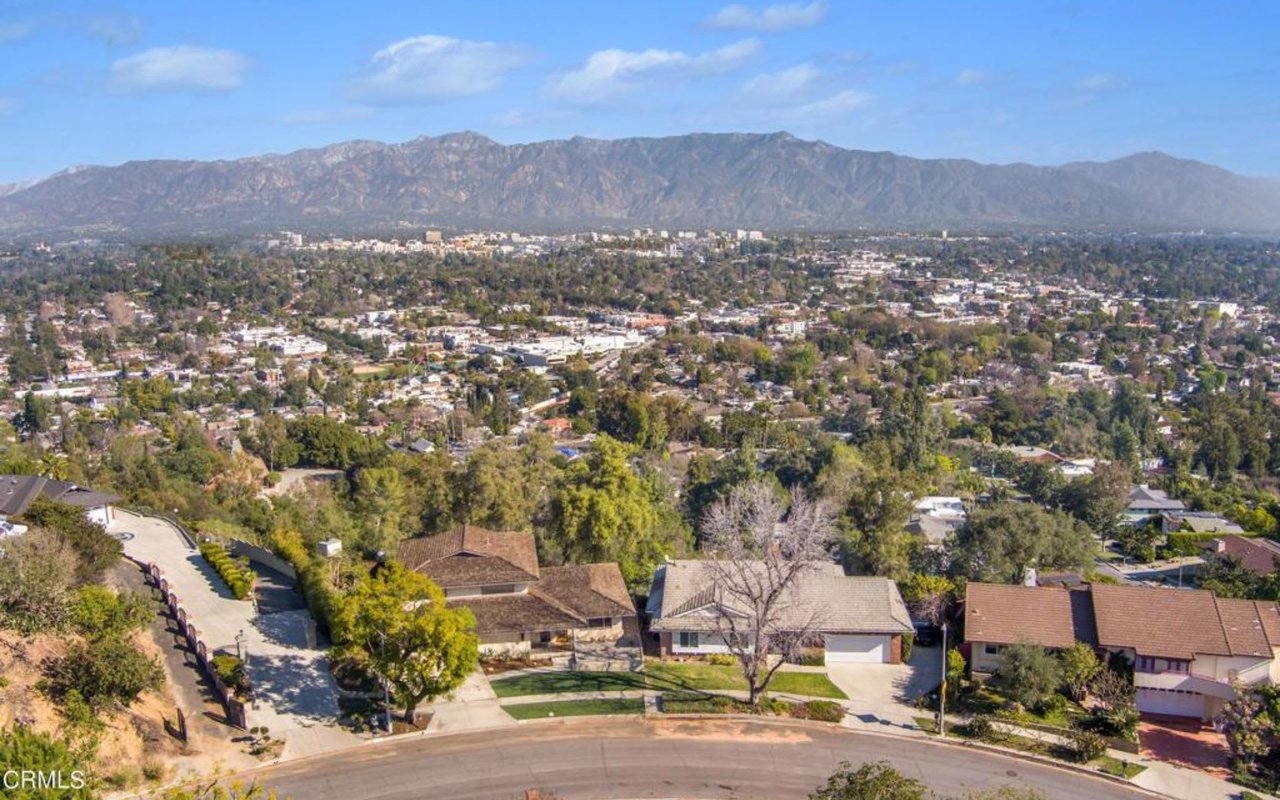
North of $2.9M in Linda Vista and the San Rafael hills. Hillside estates, thin comps, and a marketing timeline measured in months rather than weeks. Buyers should assume the sale price will be set by a small number of recent close-in comps and a longer negotiation, not by a portal Zestimate.
The one comparable that survives the mix problem
If you take one working tool away from this piece, make it price per square foot rather than median price. It is not immune to product mix, but it is far more stable across small samples. The citywide May 2026 figure is $791. The Q1 SFR-only figure is $874. Bungalow Heaven runs $856 to $878. East Pasadena runs $930. Kang's Q1 2026 comparison shows Pasadena at $874 versus Arcadia at $723, which reframes the "Arcadia is more expensive" headline that a raw median comparison produces.
When you tour a house, ask the listing agent for the per-square-foot figures of the last three closed comps inside the same district and the same product type. That is the number that will tell you whether the ask is defensible.
Short FAQ
Why does Zillow's Pasadena number differ from Redfin's? Zillow's Home Value Index is a modeled estimate across all housing stock, updated monthly. Redfin's headline number is a rolling median of actual closings. In May 2026 the two diverged by about $130,000, which is normal when a market's mix is shifting.
Is the citywide 1.7% year-over-year drop a real correction? Probably not in the SFR segment. The SFR-only median has held near $1.55M through Q1 2026. The blended drop reflects a higher share of condo closings in recent months and the softening of a few specific sub-markets, not a broad house-price decline.
Which number should I use in an offer? The three most recent closed comps in the same district and the same product type, converted to price per square foot. Then adjust for condition, lot, and any historic-district overlay. The citywide median is for headline writers, not offer sheets.
If you are trying to figure out what a specific Pasadena block is actually worth this quarter, or what your own house would clear in today's mix, The Middleman Team can walk you through the comps district by district. Request a free home valuation and we will send back a read grounded in the last thirty days of local closings, not the citywide average.